AI Landscape
A market terminal for the AI economy, from one day back to 2022.
A live market terminal for the AI economy. Chart its companies, map them by layer and size them against the world.
MarketsDataAppAbout AI Landscape
AI Landscape follows the public companies behind the AI build out, from the labs and the chip makers to the memory, the fabs, the servers, the networks, the data centers and the power that feed them. The terminal puts any number of them on one chart, in price, rebased to a common start or on a log scale, over a day, a week, a month, one, three or five years, or everything since 2022. The wheel zooms the chart and a drag moves it back in time.
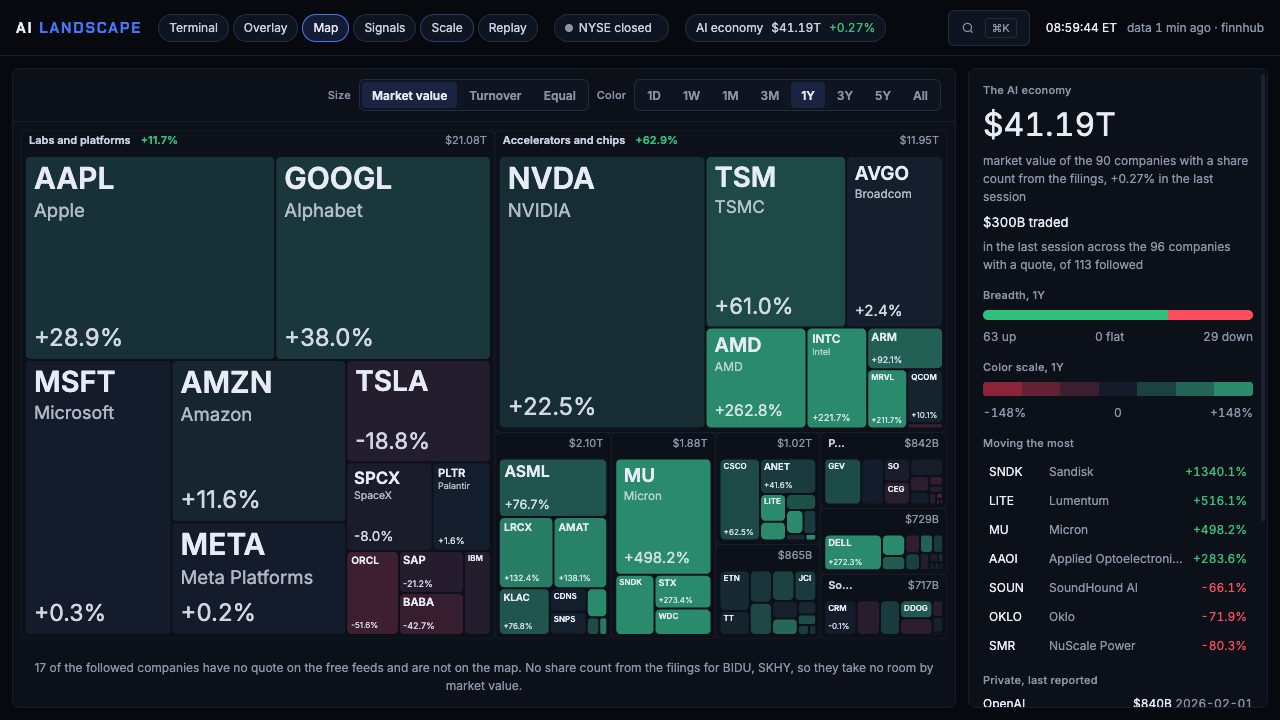
The overlay compares the layers as indices weighted by market value, with drawdown, volatility and the correlation of every pair. The map is the economy as a treemap, sized by market value, turnover or all the same, and colored by the move over the range. It zooms and pans, so the smallest companies show their names. The replay plays the timeline back with the news and the filings laid over the price.
Signals shows where the money is rotating, which layers lead over a day, a month or a year, how many companies are above their 50 day average, what the hyperscalers spend on the build out each quarter, and which companies broke away from their layer today. Market values and capital spending come from the companies' own SEC filings. Scale sets the AI companies beside all the money in the world's largest currencies, every stock market, the world's yearly output, all the gold ever mined, the oil majors and bitcoin, each from a public source with its date.
Overlay and Rebase
Any companies or layers on one chart, rebased, plain or log, with drawdown, volatility and correlation.
One Day to All of It
One range bar on every view, fifteen minute bars for the day and daily bars back to January 2022.
Map and Scale
The economy as a zoomable treemap by layer, and the AI companies set beside all the money, gold and oil.